workshop
Using the Sensor Bridge software
Make sure you already have the Sensor Bridge hardware connected (See Connecting the hardware).
Installing the application
Installing on Apple macOS
- Download the SensorBridge.dmg image from the latest release on GitHub
- Double click the image to reveal the contents
- Drag the Sensor Bridge icon to the applications folder
- Run the Sensor Bridge application
Installing on Microsoft Windows
- Download the SensorBridge.zip archive from the latest release on GitHub
- Extract the contents to a suitable location
- Run the SensorBridge.exe
Configuring the serial port

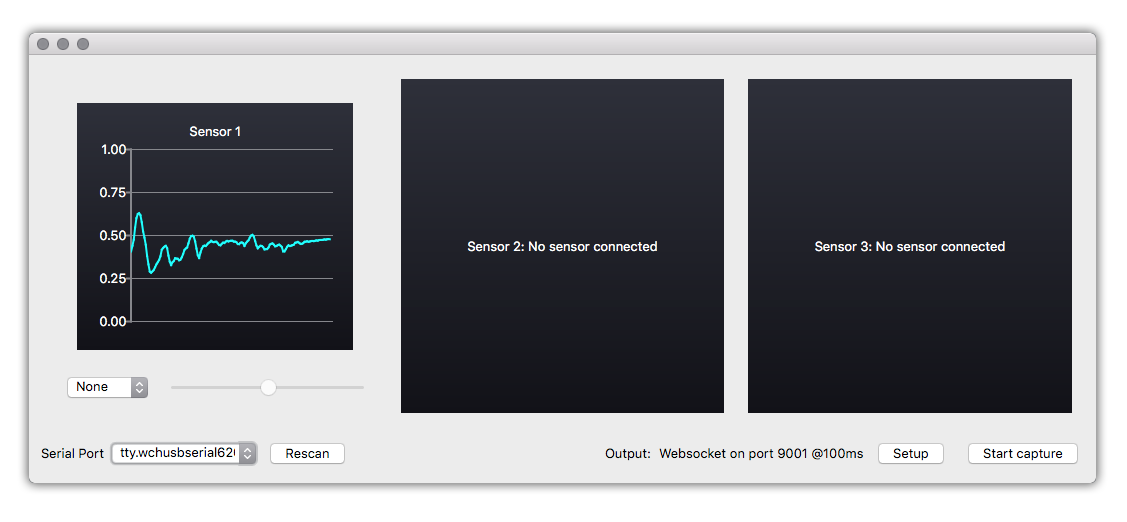
Select the serial port that the Sensor Bridge is connected to using the dropdown menu at the bottom left of the screen. If you connected the Serial Bridge after starting the application, you can click “Rescan” to update the list of ports.
For macOS users, the port will be named “tty.wchusbserial640 (USB2.0-Serial)”
For Windows users, the port will be named something like “COM3 (USB-Serial CH340)” (The actual number after COM may be different)
On some computers, the Sensor Bridge will not be recognized without installing the CH340G driver, installation instructions are here
Reading the values
Once the serial port is configured correctly, the application will show the data for the connected sensors in the graph. You can use these graphs for troubleshooting the data while making a visualization because it will always show the raw sensor data. The values are always mapped from 0.0 to 1.0 (as they will be in the output).
Applying smoothing on the sensor data
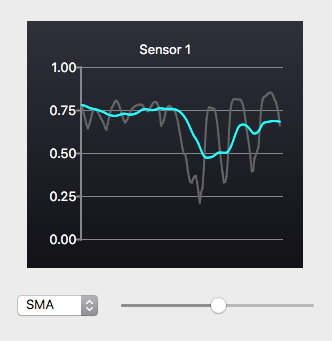
If the data is erratic, it might be useful to apply some smoothing to the data, before it is recorded to CSV or sent to another application. To do so, select one of smoothing types (other than ‘None’) from the dropdown menu below the sensor’s graph. The slider next to the dropdown menu can be used to control how much smoothing will be applied to the data (all the way to the left for no smoothing, all the way to the right for maximum smoothing).
In the graph there will be a blue line for the smoothed data (which will be capture or sent over WebSocket) and a grey line for the raw, unsmoothed data.
These are the smoothing options;
- None: No smoothing on the data
- SMA: Simple Moving Average smoothing
- EXP: Single/Basic Exponential smoothing
Using the application to capture CSV data
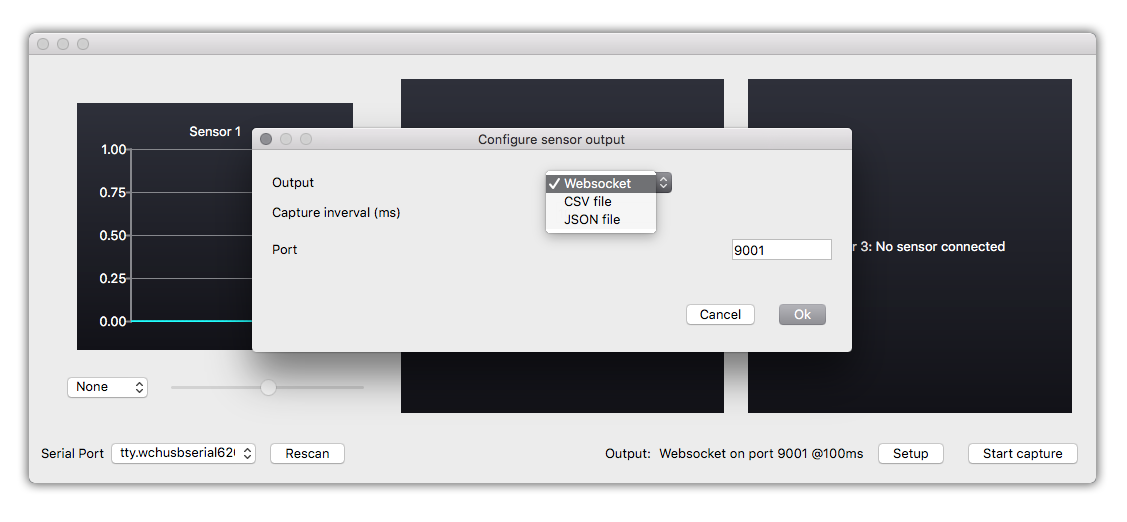
To start capturing CSV data, click the “Setup” button at the bottom right of the screen. Choose “CSV file” as the output, set the capture interval (time between data points) to the interval you want and the capture directory to the folder you want the CSV files to be stored. Click “Ok” to save the changes. At the bottom of the screen you will see a description of your output settings. Click “Start capture” to start capturing the data to a CSV file. Clicking “Stop capture” will stop the capture.
CSV file data format
The captured CSV file will have the following format:
- The first line is a header line
- The first column has the timestamp, formatted as Unix Timestamp in milliseconds
- After the timestamp there are three value columns for the three sensors.
- The field separator is a comma (,)
- The line ending is a newline character (\n)
Example CSV file:
timestamp,sensor_1,sensor_2,sensor_3
1503578607880,0.00814598,0,0
1503578607890,0.00814598,0,0
1503578607900,0.00765722,0,0
1503578607910,0.00765722,0,0
Using the application to capture JSON data
To start capturing JSON data, click the “Setup” button at the bottom right of the screen. Choose “JSON file” as the output, set the capture interval (time between data points) to the interval you want and the capture directory to the folder you want the JSON files to be stored. Click “Ok” to save the changes. At the bottom of the screen you will see a description of your output settings. Click “Start capture” to start capturing the data to a JSON file. Clicking “Stop capture” will stop the capture.
JSON file data format
The captured JSON file will contain an array of data frames, each containing three sensor values and a timestamp in as Unix Timestamp in milliseconds
Example JSON file:
[
    {
        "sensor_1": 0.05669599398970604,
        "sensor_2": 0,
        "sensor_3": 0,
        "timestamp": 1503913184813
    },
    {
        "sensor_1": 0.039100684225559235,
        "sensor_2": 0,
        "sensor_3": 0,
        "timestamp": 1503913185009
    }
]
Using the application to serve sensor data over a WebSocket
If you want to use live data in an application (Processing, Web, Unity3D or something else) you can use the WebSocket capture option to serve data from the sensor bridge. To do so, click the “Setup” button at the bottom right of the screen. Choose “WebSocket” as the output, set the capture interval (time between data points) to the interval you want and the port to serve the data on (10ms is recommended for live data). Click “Ok” to save the changes. At the bottom of the screen you will see a description of your output settings. Click “Start capture” to start serving the data over WebSocket (you might get a firewall notification to open up a port). You will now be able to connect a WebSocket client on the configured port to listen for data. Clicking “Stop capture” will stop the WebSocket server.
The WebSocket server will pass data packets with one reading with the following format:
Example Websocket message:
{
  "sensor_1": 0.232132,
  "sensor_2": 0.232132,
  "sensor_3": 0.232132
}
To easily test the WebSocket server, you can use the WebSocket.org echo test; use ws://localhost:9010 as the location (or ws://localhost:{port} if you didn’t use the default port). You should see the sensor values appearing in the log.